Support tickets
“Which product area needs attention first?”
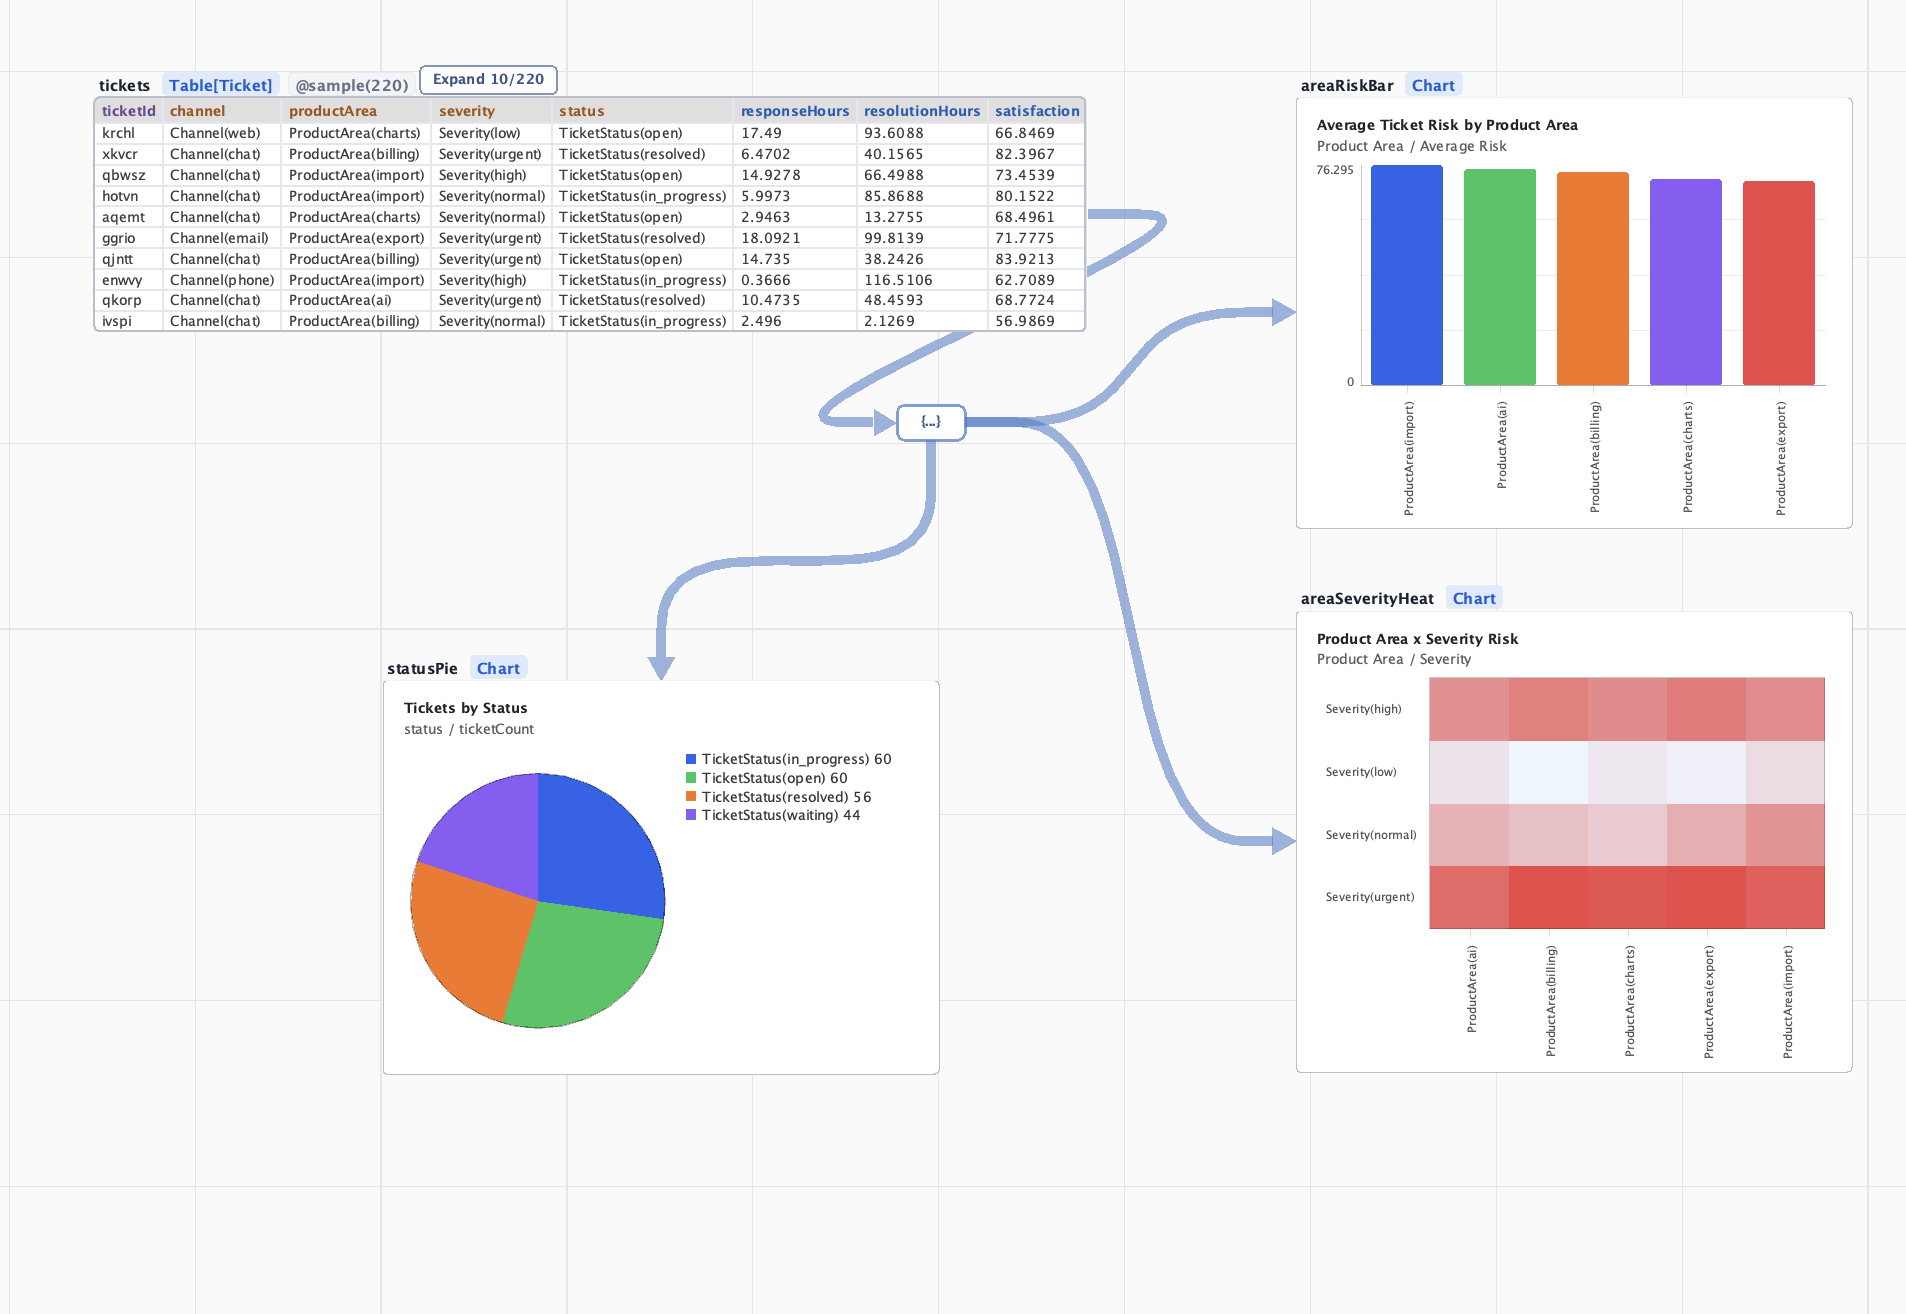
Fuga turns raw ticket rows into risk scores, status breakdowns, and product-area heatmaps while preserving the link back to the source ticket table.
 Fuga
AI-powered spreadsheet automation for Windows
Fuga
AI-powered spreadsheet automation for Windows
Drag in Excel or CSV files, ask in plain English, and Fuga creates cleaned tables, calculations, charts, and export files while keeping every step visible on one canvas.
Raw data → question → results
Fuga keeps the original data, the AI-generated analysis, and the final charts on the same canvas. You can see exactly which outputs came from which table instead of trusting a disconnected answer.
Load or generate a table such as tickets, deals, feedback, or sensor readings.
Ask in plain English: find risks, summarize trends, or create the charts you need.
Fuga creates derived tables, charts, and a visible dependency path back to the source.
Fuga turns raw ticket rows into risk scores, status breakdowns, and product-area heatmaps while preserving the link back to the source ticket table.
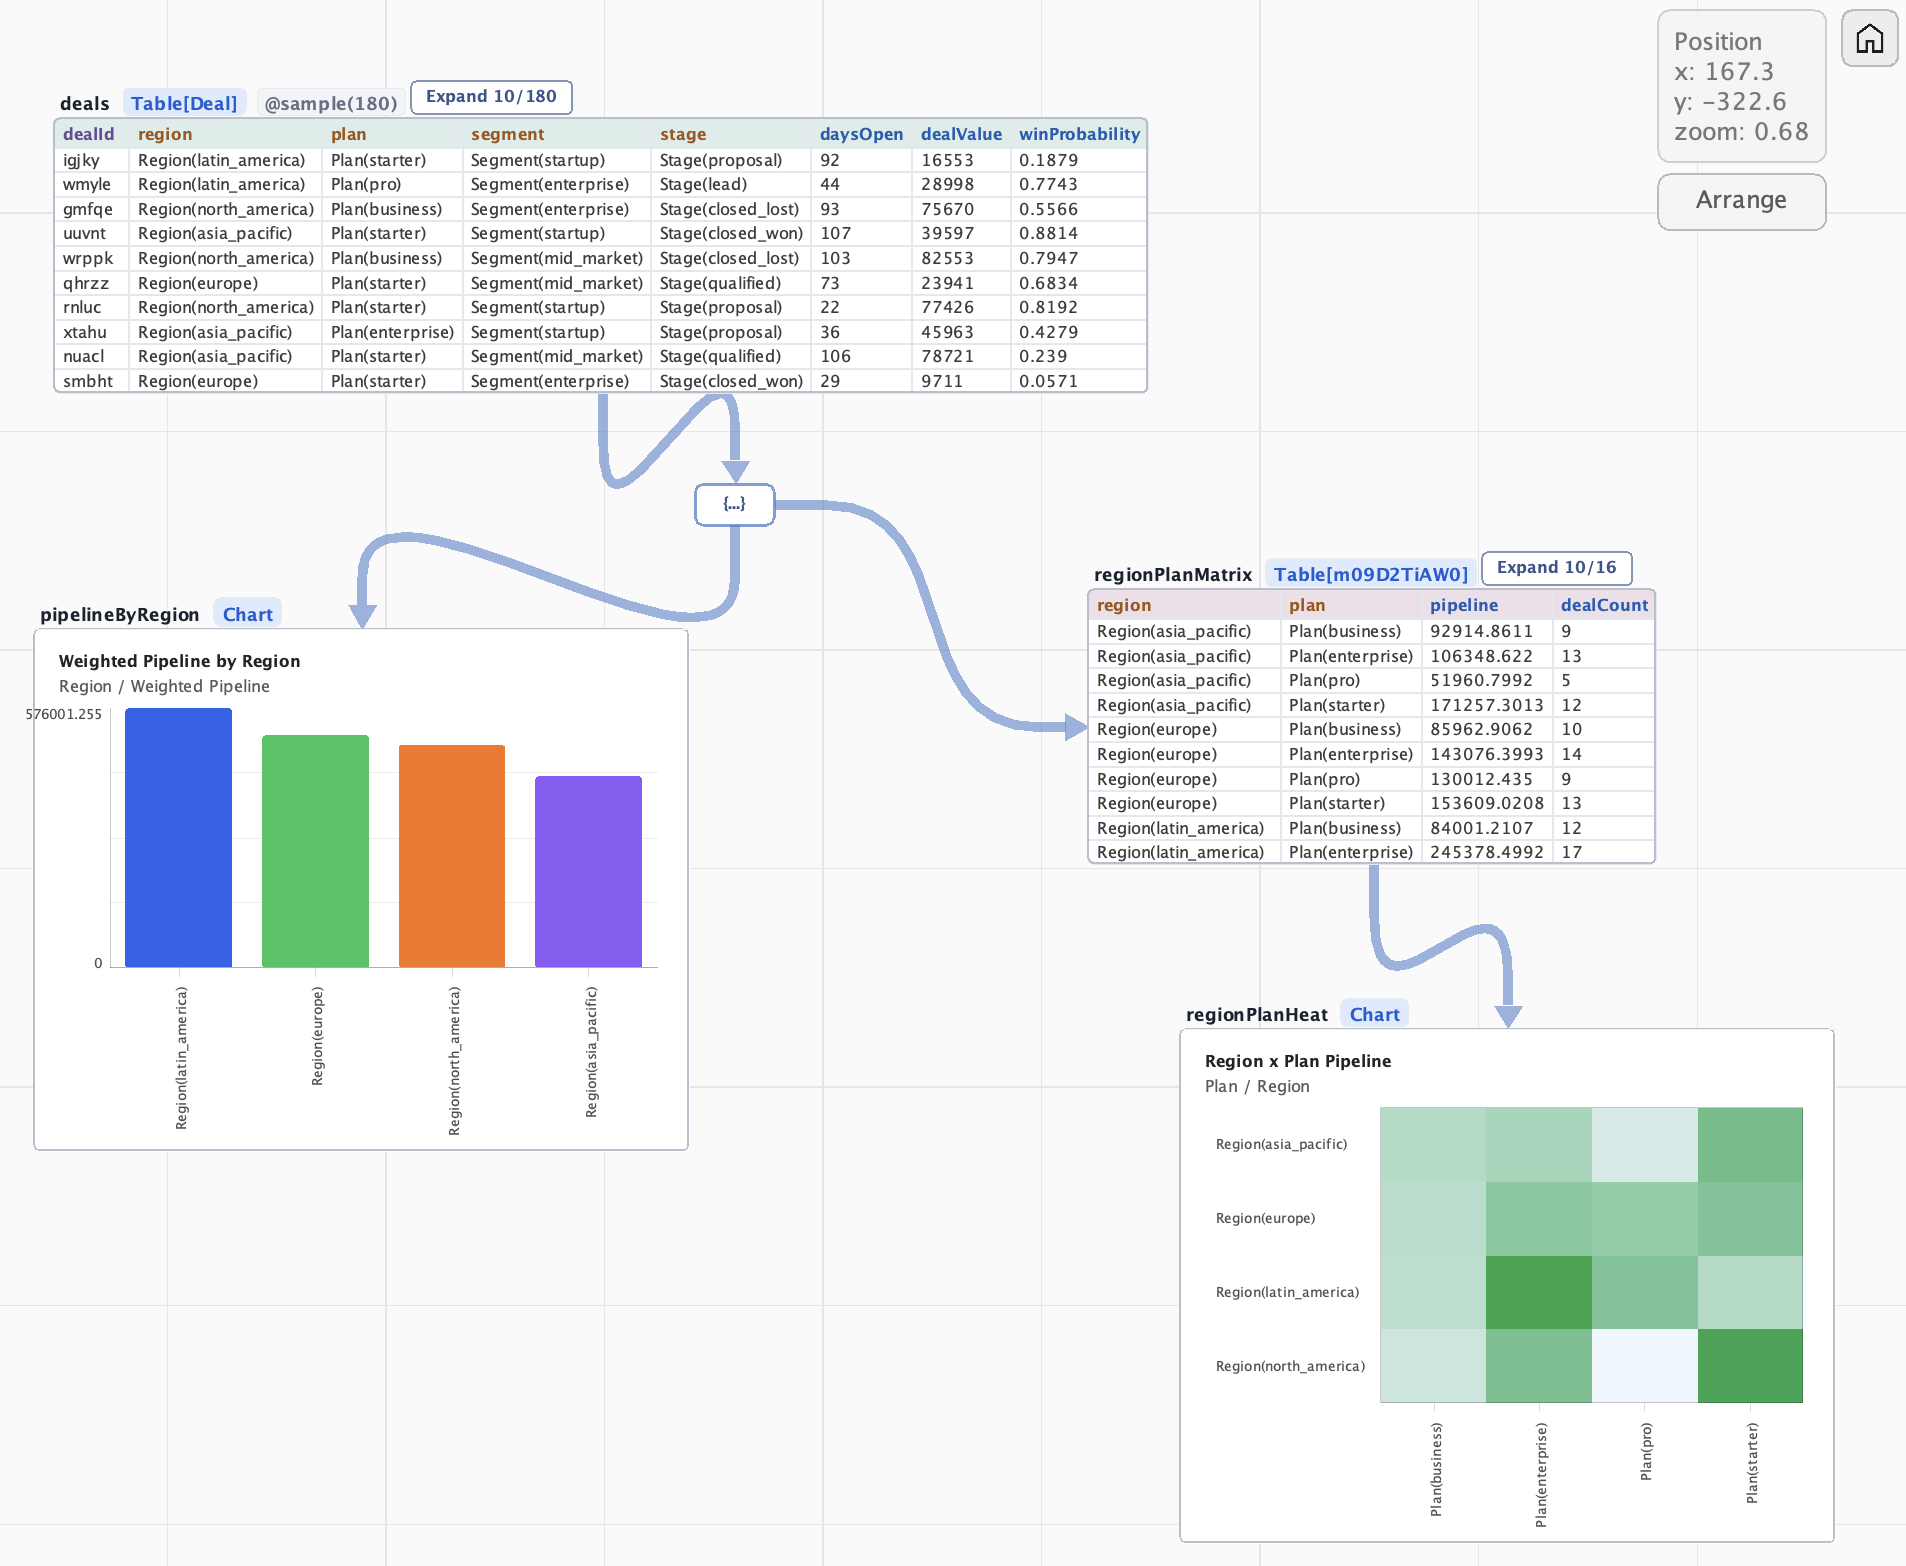
Analyze deals by region, plan, stage, and pipeline value, then inspect the generated charts on the canvas.
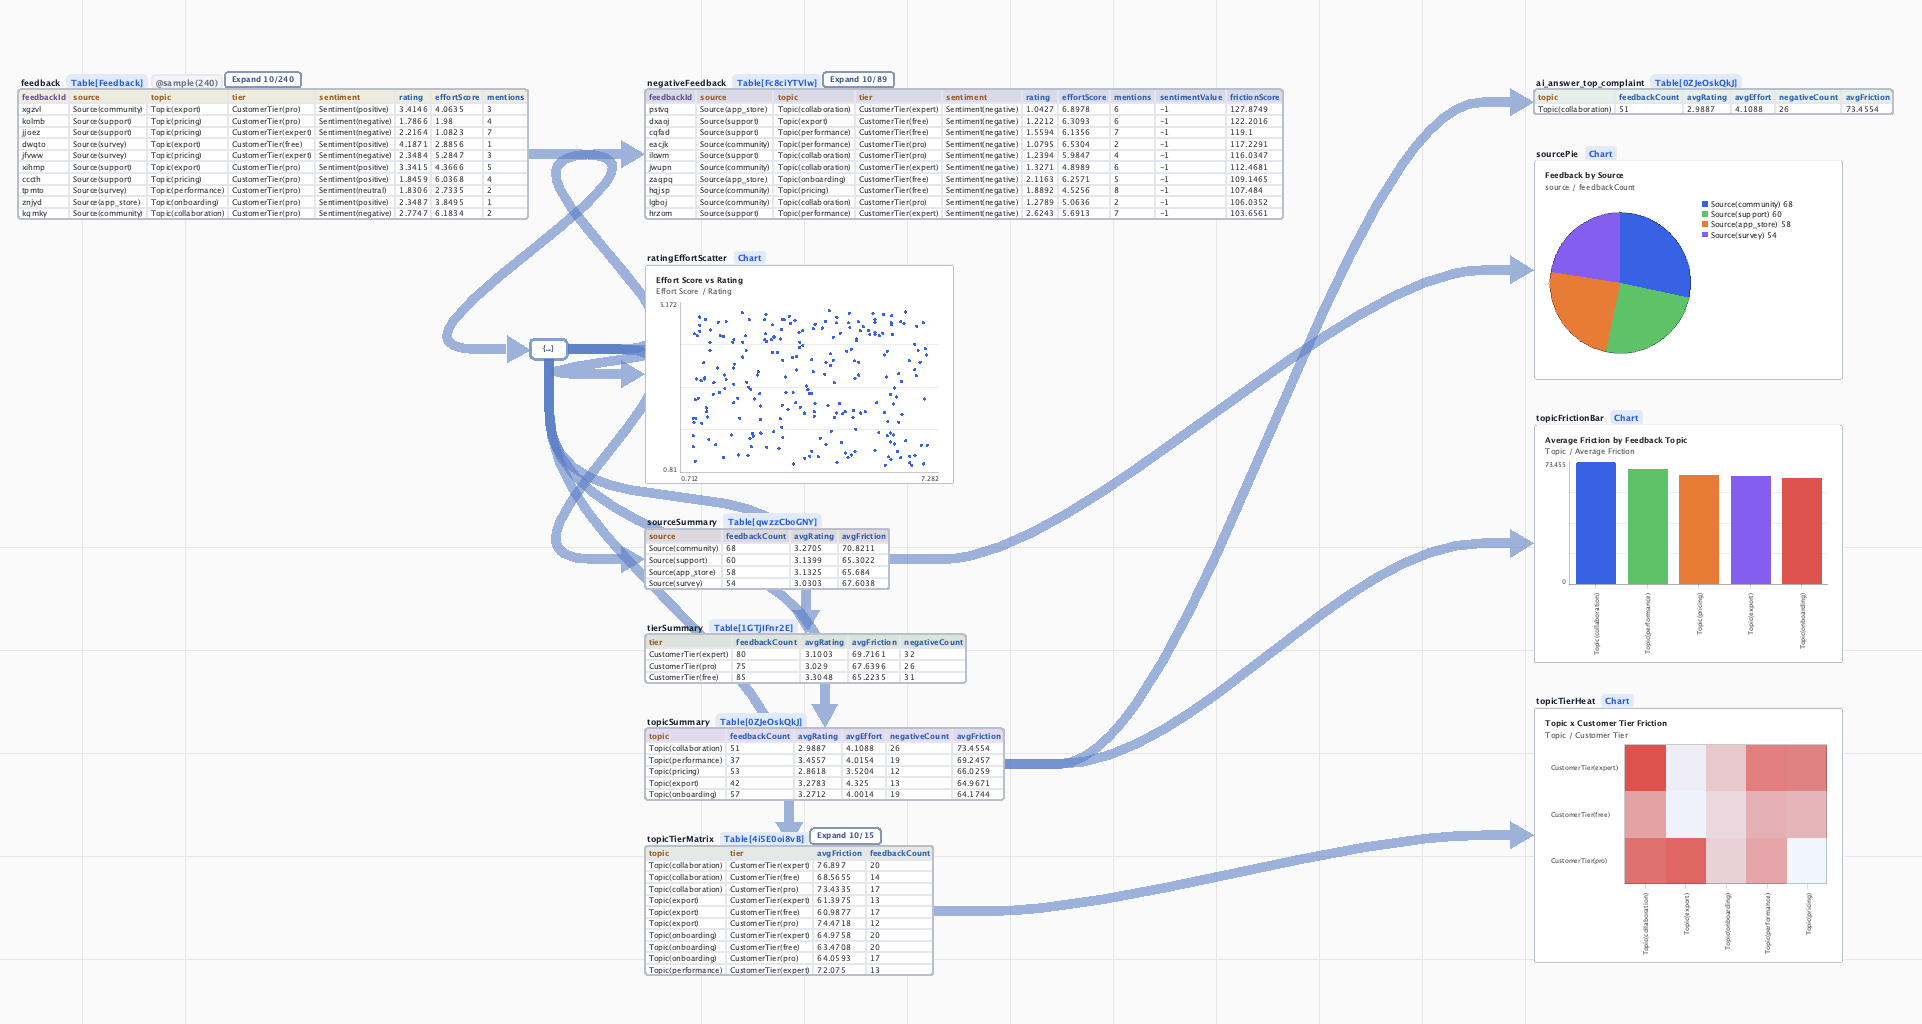
Summarize feedback topics, negative comments, friction scores, and customer-tier patterns in one workflow.
What Fuga does
Spreadsheet work often gets split across manual cleanup, formulas, charts, screenshots, and report files. Fuga starts from a file and a prompt, then keeps the generated tables, charts, relationships, and calculation steps visible for review.
Product screens
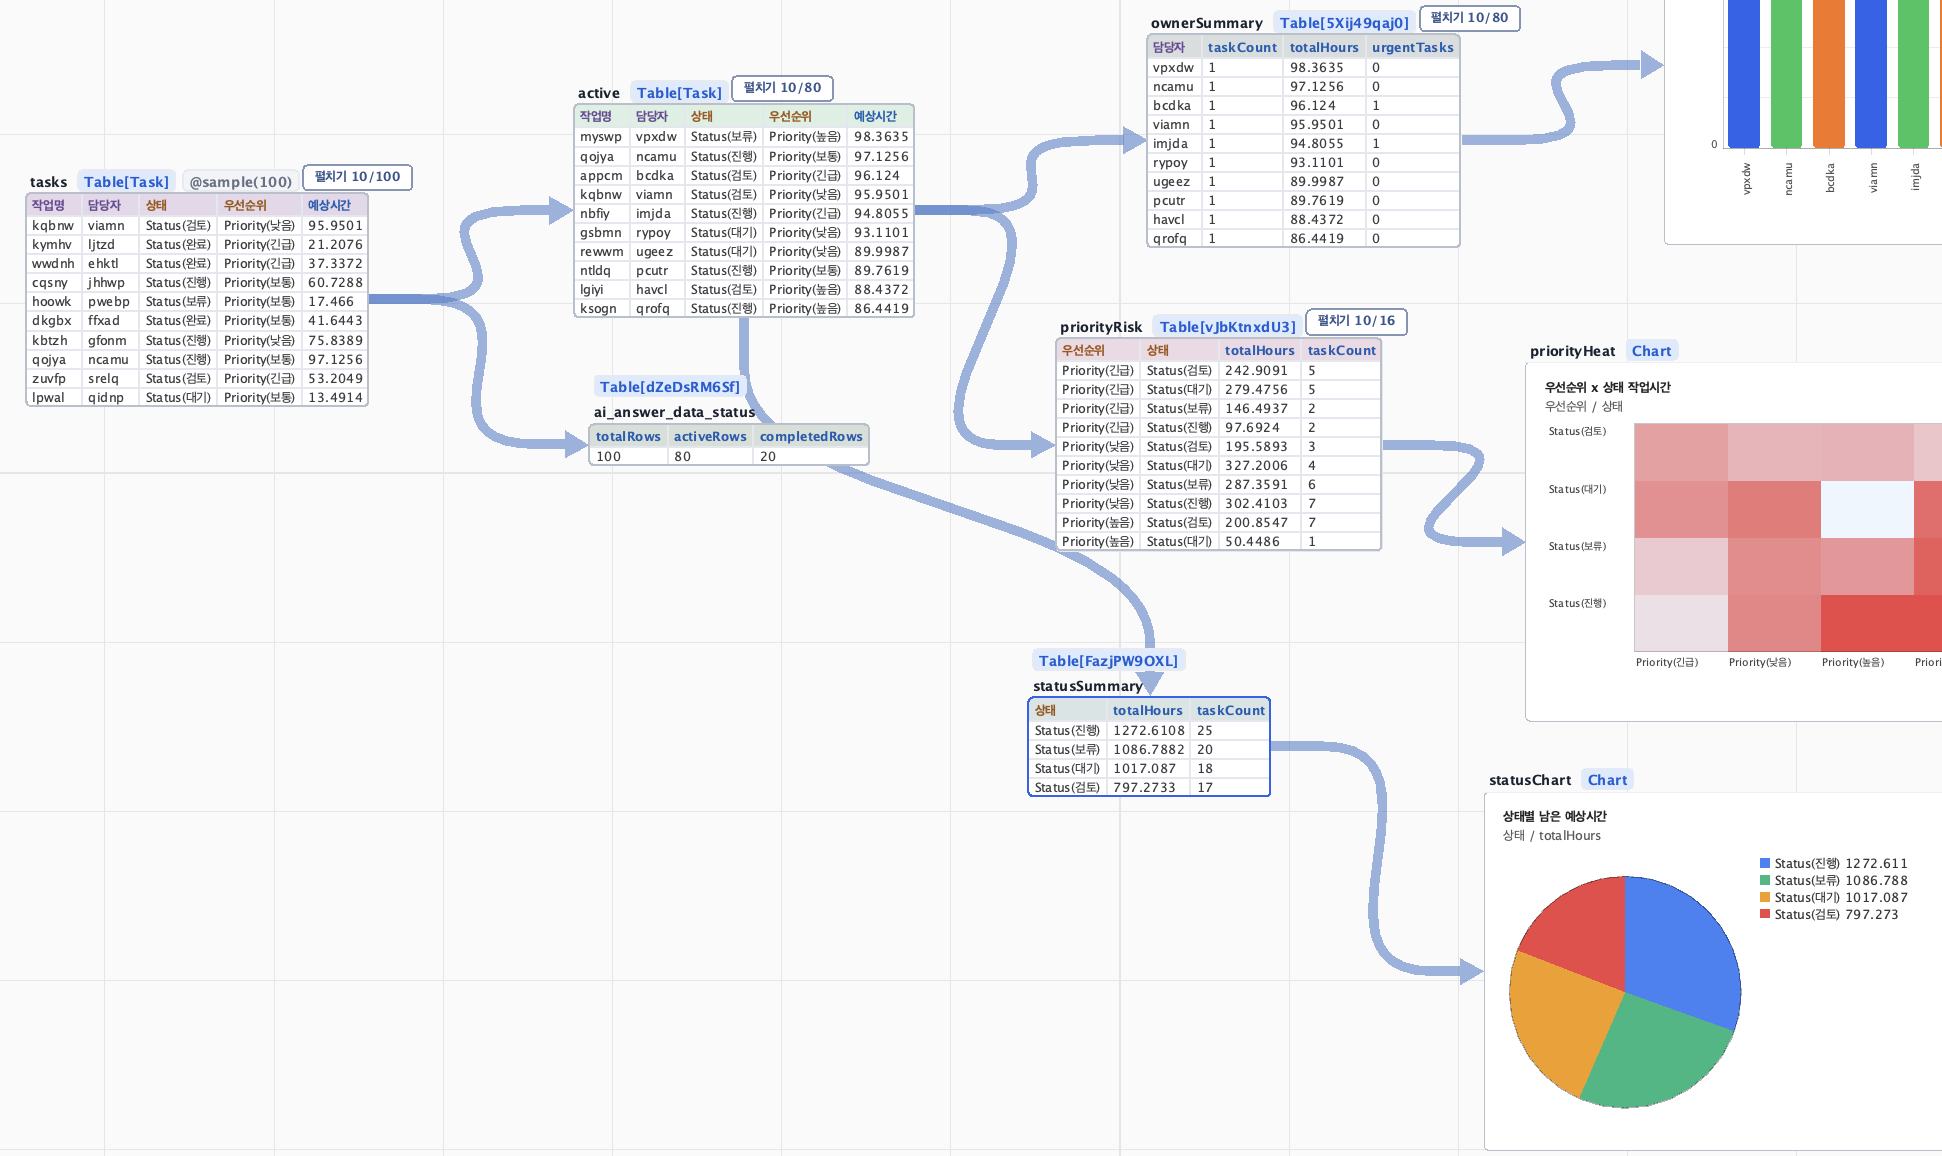
AI-generated results are difficult to trust when their sources are hidden. Fuga places source tables, intermediate calculations, and final charts on one canvas, and keeps the code that created them inside the project.
Start from raw tickets and generate status, risk, and severity charts in one visible workflow.
Turn deal rows into regional summaries, pipeline charts, and heatmaps.
Connect raw feedback to complaint summaries, source breakdowns, and tier/topic heatmaps.
Core features
Add Excel, CSV, and TSV files and organize them into analysis-ready project tables.
Create filters, summaries, calculations, rankings, and comparisons from plain-language requests.
Create bar, line, scatter, histogram, box plot, heatmap, and other charts as needed.
When AI reads files, edits tables, creates results, or exports files, each action remains visible as a card.
Paid plans can export tables and charts as XLSX, CSV, TSV, or PNG files.
Source data, intermediate results, final outputs, and automation code stay together for later review.
Purchase, delivery, and support
You can download the app before purchase. Paid subscriptions unlock higher AI usage and export features. Fuga Pro is $12.00 USD per month and Fuga Expert is $29.00 USD per month. Taxes may apply and will be calculated at checkout. Payments, invoices, subscription management, and eligible refunds are processed through Paddle.
Fuga Pro costs $12.00 USD per month. Fuga Expert costs $29.00 USD per month. No trial or introductory discount is currently offered.
A Windows installer for the Fuga desktop app, Google sign-in, AI-powered analysis features, and plan-based monthly usage limits.
There is no physical shipping. The installer is delivered by download and the subscription status is applied to the signed-in account after payment confirmation.
Subscriptions can be cancelled through Paddle's buyer portal from the purchase confirmation email or by contacting support. Cancellation stops future renewals.
For billing, account, technical, or refund questions, contact sangyuny123@gmail.com. We aim to respond within two business days.
Review the pricing page, terms, privacy policy, and refund policy before purchasing.
AI assistant
Fuga's AI assistant is not just a chatbot that replies with text. It can read files, create tables, generate charts, and export outputs as real project actions. Those actions remain visible as cards and canvas structure, so you can inspect what happened.
Download
The Fuga 1.2.2 Windows installer includes the runtime needed to launch the app. After installation, open Fuga from the Start menu or desktop shortcut.